Dataset analysis: Key personal indicators of heart disease from kaggle.

In this work, the data set will be used: Key personal indicators of heart disease, data from 400,000 adults, obtained during the 2020 annual survey of the Centers for Disease Control and Prevention (CDC, for its acronym in English) belonging to to the Department of Health and Human Services in the United States. Originally the data set contained around 300 attributes, however, it was reduced to only 18 variables, which are the ones that are publicly available on the Kaggle platform [6]. Nearly half of Americans (47%), including African Americans, American Indians, Alaska Natives, and Whites; have at least 1 to 3 risk factors for heart disease. A brief description of the attributes included in this dataset is added below: HeartDisease: (decision attribute): Respondents who reported having ever had CHD or MI.
- BMI: Body Mass Index.
- Smoking: respondents who have smoked at least 100 cigarettes in their entire life.
- AlcoholDrinking: corresponds to adult men who drink more than 14 drinks per week and adult women who drink more than 7 drinks per week.
- Stroke - answers the question: have you ever been told or have you had a stroke?
- PhysicalHealth: including physical illnesses and injuries, answers the question: for how many days in the last 30 days was your physical health not good? (from 0 to 30 days)
- MentalHealth: On how many days in the last 30 days was your mental health not good? (from 0 to 30 days).
- DiffWalking: answer do you have serious difficulties walking or climbing stairs?
- Sex: male or female.
- AgeCategory: 14 age ranges.
- Race: imputed race/ethnicity value.
- Diabetic: Answers to Have you ever been diagnosed with diabetes?
- PhysiclActivity: adults who reported having engaged in physical activity or exercise in the last 30 days, not including their usual job.
- GenHealth: answer how would you rate your overall health?
- SleepTime: responds to the average number of hours the person surveyed sleeps in a 24-hour period.
- Asthma: Answers to Have you ever been diagnosed with asthma?
- KidneyDisease: Answers to Have you ever been told you had kidney disease?, not including kidney stones, bladder infection, or incontinence.
- SkinCancer: answers to have you ever been diagnosed with skin cancer.
- Load database.
- Analyze the dataset by calculating the number of attributes, instances, and missing data.
- Know the attributes, the type of attribute, as well as how many and which observations they contain.
- Understand the relationship between attributes by calculating quartiles, outliers, and their boxplot.
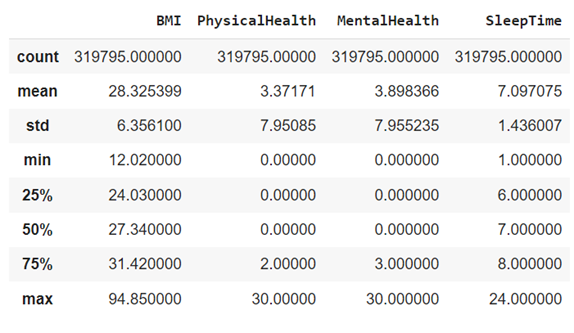
- Calculate and know the statistical values of each attribute, such as mode, mean, maximum value, minimum value, variance and standard deviation.
- Know how related the attributes are to each other through covariance.
- Observe the type of distribution that the attributes have.
- Discover if the classes are balanced, as well as the percentage of each of them.
Methodology:
From the functions developed, the following information from the database can be known. The results obtained by entering the Key Personal Indicators of Heart Disease data set into the data analysis program are shown below:
El dataset tiene 319795 instancias
The Missing_Data() function allows knowing the amount of missing data, so that the user can decide whether to perform a data imputation. In the specific case of the data set used, none of the attributes present missing data, however, this is not always the case. When there are missing data, the proportion of these must be considered and the necessary imputation methods must be assessed according to the nature of the data with which one works.
Now, in terms of statistics, the mode of the attributes, their maximum and minimum values, their mean or average, standard deviation, variance, and covariance were calculated and compared with the calculation of the same metrics using the Python libraries.
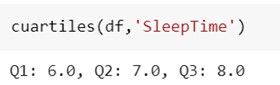
Now, using the quartiles() function, the following quartiles were obtained for the SleepTime attribute, which coincide with what was obtained using the python libraries.
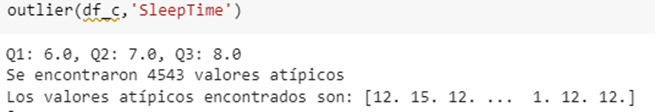
Once the quartiles have been calculated, with the outlier() function it is known that the attribute has the following number of outliers:
Since the quartiles are available, it is possible to make a box plot, with the Q1, Q2(median) and Q3 quartiles. In this case, the box plot of the BMI attribute is presented.
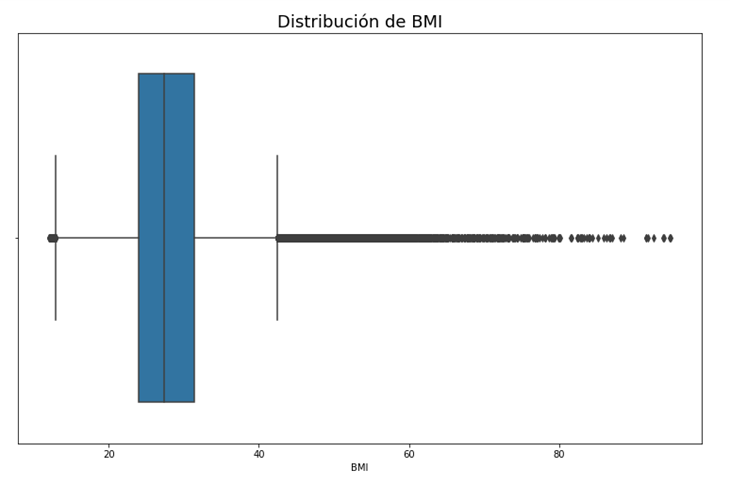
A large number of outliers can be inferred from the Illustration above, exactly 10,396, as obtained with outlier(). Given that the median of the distribution is equal to 27.34, the equivalent of an overweight person, it can be said that 10,396 people are above this category. Likewise, by means of a histogram of the attributes it is possible to know the type of distribution that they follow. The following illustration shows the distribution of the BMI attribute.
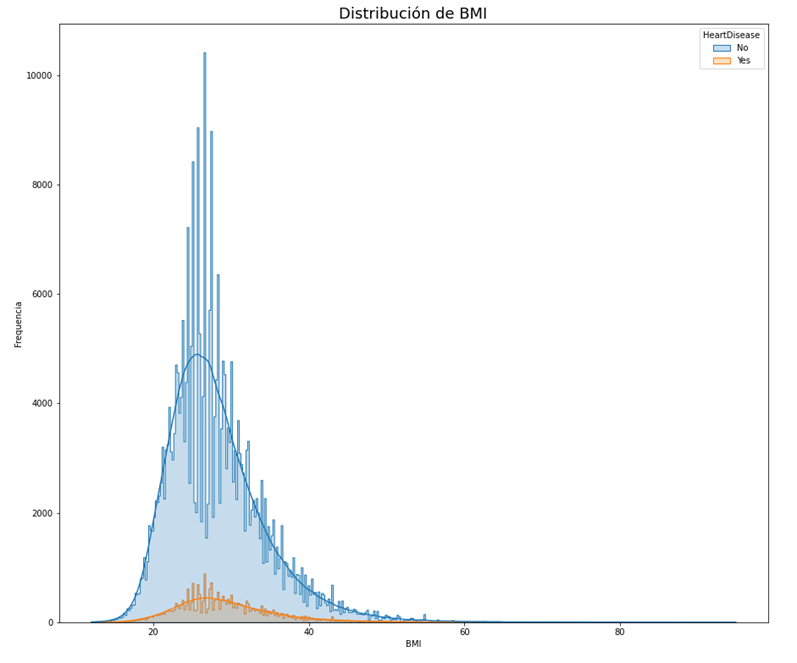
Now, with respect to the class balance, it can be said that there is a class imbalance with 91.44% for the 'No' class and 8.5% for the second class 'Yes', being the decision attribute HeartDisease.
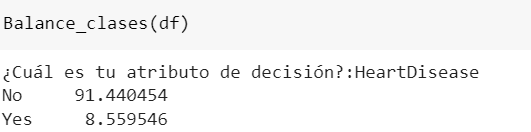
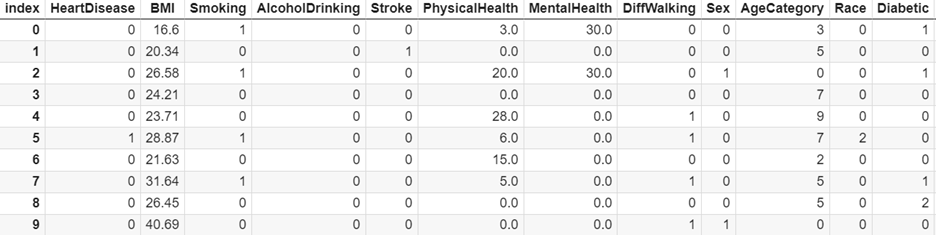
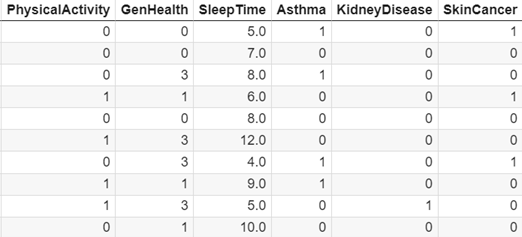
In the understanding that it is necessary to make a balance of classes, since the proportion between the only two classes is over unbalanced. On the other hand, additionally, an encoded data set (from categorical to numeric) was created from a copy of the original data set, using the conversion() function. This function is responsible for assigning a numerical value to each of the observations of the categorical attributes. Where as a result it was obtained:
Basically, in this generalized program -for any database- functions were generated that would allow knowing the behavior of the attributes and instances of the provided data set, as well as functions that allow obtaining statistical metrics from the data. From the analysis carried out on a data set, it can be inferred if a class balance is required, if there are missing data and which imputation method to choose or if it is more convenient to eliminate the attribute or instance, which attributes are most relevant for the task what is sought to be done using the data, and the relationship between the attributes, as well as the behavior or trend of the data and whether the outliers are valid or invalid. Fortunately, the database used in this work does not present missing data, however, this is not common. Finally, it is worth mentioning that data analysis is step 0 in the preprocessing of the data, since in this way you know what to expect from them, however, the data still needs to be normalized, since this facilitates and avoids biases in the comparison and analysis of these.